shape
carat
color
clarity

Fire and dispersion techy help please?

It tells us to be wary of a machine that attempts to measure "fire" square to the table?

The fine-ness of the make has no effect on the quality of dispersion, only the quantity? That is, an ideally cut stone has more fire only becuase it reflects more rays and those rays then have a chance to become dispersed?

Maybe the better cuts have more dispersion because the rays likely to be leaked are also those more likely to get dispersed?
 
Thanks Beryl.

What partly started this was a study of 70 fancy shapes with the ideal-scope and extensive observations in a variety of lighting conditions last week.

The diamonds with the best looking ideal-scope images had more fire, especially inside the table region.
 
R.A.: Good to hear from you again.

. I think it tells us that we see more fire when viewing the gem obliquely.

Garry: How do you define a 'best' scope image? How would someone else know what you judge as 'best'?

Others:
. In my previous mention of re-constructing the source ray with identical prisms back-to-back, it would be necessary to interpose a cylindrical lens which would convert the diverging spectrum from the first prism into a symmetrically-converging spectrum to enter the second prism. This would require a lens without aberrations, which does not exist; therefore it would have to be done with a concave mirror. All academic, but I wanted to correct my earlier statement in case of snipers.
 
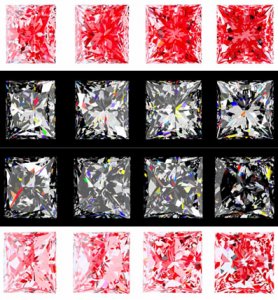
This is just a few images I had lying around that were all taken with exactly the same lighting and exposure.
They are best to worst, although there is not much between the two in the middle.

Untitled-9.jpg
 
Garry: But how do you define 'best' and 'worst'?
 
Dear Mr. Cut Nut

I have been trying to get from GIA the precise specifications and measures they use for their grading. Which degree of angle the diamond needs for obtaining very good or good or excellent.
They do not seem to have published clear rules and guidelines. HRD does have clear parameters. Do you have the parameters for GIA. If you do could you e mail them to me

thanks

roughdiamond

[email protected]
 
With great difficulty Bruce.
More red = better
But fancies are not as simple as rounds.
 
Garry:
. Possible fallacy. Beware the significance of face-up view alone.
. Recall the 5-sided stone I discussed in 'FacetDesigner' Newsletter 02. I achieved total red in the face-up view and thought that was excellent, but found that it changed rapidly when tilted. Nevertheless, it did turn out to be a very attractive gem when viewed dynamically, because of the nice contrast pattern.
 
You read my mind Bruce.

These are from scans of real stones.
Amazing how well the ideal-scope works with fancy cuts.
This shows how fire comes out of the table. I need to follow some of the fire displays back and see if it is light that etered the crown, or as I suspect - it is low angle light that has entered and left via the table.

Princ466And465Sm.jpg
 
Garry,

these pics alone seem sufficient to make a Iscope chart for princess cuts.

Why not ?
 
. I do not know details of the Princess cut. Can anyone provide a typical diagram, perhaps with slopes and indexes?
. I am making tables of refraction in diamond for sodium light (standard), and red & violet extremes. With this one can determine angle of refraction and degree of dispersion for various incidences without calculation (every 1° of entry; every ½° of exit). Table is better than chart in this case. Anyone interested?
 
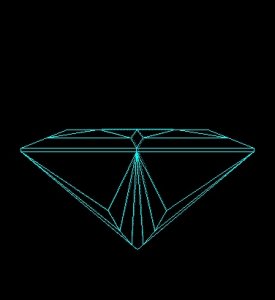
Here is a princess profile looking at a corner Beryl.
Table is typically about 75% and depth is similar.

The chart idea sounds great - it means we can calculate exit dispersion?
Should we have one that does entry dispersion too?
And what about entry and exit dispersion?

Please Sir, may I be excused. My mind is full.

princessfromthecorner.jpg
 
Garry:
Thanks for 'princess' diagram; if it is accurate, I can calculate all of the slopes and indexes from this - believe it or not. (Yes, I know the correct plural of 'index' is 'indices')
The charts/tables will enable you to do all of the things you just mentioned, and that we discussed at the outset of this thread, without the need for calculation ...
(1) knowing the angle of incidence a ray enters the diamond it will tell you the direction of the refracted ray in the gem and the angular width of its dispersion;
(2) then, at the exit end, after you determine the incidence of the ray exiting the diamond (by geometry or tunnel diagram), it will tell you the angle of the ray refracted out, and the added dispersion of this ray;
(3) adding the two dispersions, you should have the total dispersion of the ray at exit; that is, if a ray has 1° dispersion at entry, and its median has 2° at exit, the final dispersion will be 3° - I think - to be confirmed.
This will enable anyone to do what I did before without trigonometry. A few will find it useful; for me it is fun.
 
Garry:
It is not working out as simply as i hoped and described, but I think I can still develop a simple way to combine the dispersions at entry and exit. No more time today; back at you later.

LATER (8:30 PM):
Better but not good enough; will try to improve it more.

PS: I was wrong about cut - also need top& bottom views to calculate data. Will visit Rhino, as Stormdr suggests below.
 
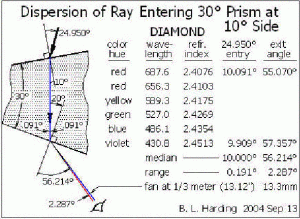
Here is another example I developed the hard way in trying to verify a simpler way. In this case I have omitted the intermediate colors. The standard RI for normal calculations is that of sodium light (yellow @ 589.3 nm ) = 2.417.

disp3.GIF
 
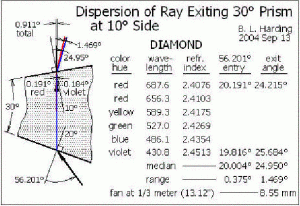
And here is the 'same' ray going the other way. Again we see that the dispersion is dimensionally greater when the ray EXITS at the greater of the two incidences.
Thank you, Garry, for bringing this up. I think that now everyone must agree that light is not reversible.
Oops - forgot pic and can't edit it in. See next post,
 
Trouble trying to upload pic because of prior attempt to edit it in. Had to give it new name. I hate sending pics by cybermail!!!!!!!
13.3 mm wide spectrum at 13" - that's more than 1/2-inch - WOW! You could not see whole spectrum - nominal pupil size is about 3mm (1/8-inch), so you will see only one color at a time. Theoretically there are cases where we see more than one color from a single facet at a single orientation, and also see the color change on one facet as we rotate it slowly. I have never noticed either of these - now I will look for them.
LATER CORRECTION: 'range' .191 should be .182.

disp5.GIF
 
Slight error in last post: 'range' of entry ray is 0.182°, not 0.191°.
I am assuming all readers realize that such precision in numbers is purely academic for the purpose of comparing small differences between comparatively large numbers. Typically in discussing faceted gems it is silly to consider more than one decimal place of angles, since we generally cannot set or measure them more accurately than that.
It amazes me that the contributors to Dana's 'Mineralogy' were able to measure RI to 4 decimal places (they cite an accuracy of +/- .0001).
 
Having more dispersion on exiting the higher angle makes sense from the old physics model of the car driving between sand and firm pavement to represent the two refractive indices. When traveling from sand to pavement at a skew angle, the car will steer harder in the skew direction as one wheel grips the firm pavement as the other wheel continues to bog in the sand. Blue light would deflect that much more than red light because of the shorter wavelength. It is not as much of an effect as the car angle gets more perpendicular to the sand/pavement line.

Someone mentioned lasers and how they would be affected. Because the wavelength (colors) of the laser is all precisely the same one, all the waves will bend exactly the same amount, and there will be no dispersion caused by the difference in refractive index. Diamonds are pretty new to me. Lasers are old friends of mine.
1.gif
 
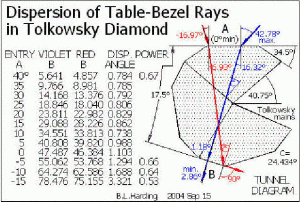
Someone asked me, offline, about dispersion in the Tolkowsky diamond. The best tool to see this is DiamCalc. My simple 2-D analyses are very limited, considering only the mains and ray paths in planes perpendicular to the table; it is likely that the most dispersion comes from the crown break facets; nevertheless, my approach shows principles and trends.
Here is the tunnel diagram. note that it simulates a wedge prism, like what I illustrated previously, with a vertex angle of 17.5°, but with the internal limiting factor of the critical angle at a pavilion face. I show one ray in blue and one in red just for visual discussion - they both are dispersed white rays. The path angles I show on the diagram, and the critical angle C, are for RI = 2.417 = sodium light (yellow) to see the approximate limits of the rays.
Note that the blue ray is limited by the critical angle C at its first incidence with the pavilion; if the entry angle A is 43° or more it will pass out through the side of the pavilion at that incidence. It is important to beware this limit when using tunnel diagrams.
The transmittance (power) is shown because it is an important consideration when making comparisons. As the exit angle B approaches 90° this approaches zero, so you have great dispersion angle with no intensity!
In this illustration we are looking at table-to-bezel rays. Since the entry angle A is less than 43° the entry transmittance is about 82% for all rays. The variation comes at exit = 67% most of the way, but dropping-off fast toward the red-ray limit - down to 53% at only 2° from the limit, then down to 0% in those last 2°.
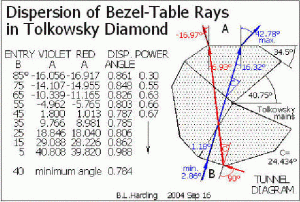
It appears that the reverse case, of bezel-to-table rays, is less effective; rays entering with high dispersion have very low intensity. Perhaps I will solve this case too.
There may be some calculation errors (big thumb/small calculator) but the pattern of the data appears smooth, indicating approximate correctness. I will advise later if I find any noteworthy errors.
LATER (8:25PM): Error at 'ENTRY A'=10°, VIOLET B =34.726, DISP.ANGLE = 0.913.

tolkdisp.GIF
 
Wow Beryl, that is just too much to soak up after 3 glasses of wine over dinner!

But for others benefit - these DiamCalc images show the difference between power and intensity.

Power vs Intensity.jpg
 
Here is one with a greater difference.
Would I be correct in saying that if a bright narrow beam enters and it exits as a very wide beam, the intensity will be greatly reduced?

Power vs Intensit1.jpg
 
And here is one of the reasons that it is not good to allow light to fall on a diamonds pavilion when making a buying decision. Obviously this is intensity data - Power can not add up to more than 100%

WowIntensity.jpg
 
It is important to explain that power is the percent AMOUNT of source light in a beam, which adds to 100% for all components, while INTENSITY is that POWER divided by the cross-sectional area of the beam and can become quite low for beams entering very obliquely (but increases again at exit), as Garry's DiamCalc picture shows.
The INTENSITY differences look significant in this close-up view of the gem, but are they as significant at viewing distance? - only if the exit beam is wider than the pupil, I think, which is generally true if we see only one color in the spectrum of dispersion.
 
----------------
On 9/16/2004 7:16:57 AM beryl wrote:

It is important to explain that power is the percent AMOUNT of source light in a beam, which adds to 100% for all components, while INTENSITY is that POWER divided by the cross-sectional area of the beam and can become quite low for beams entering very obliquely (but increases again at exit), as Garry's DiamCalc picture shows.
The INTENSITY differences look significant in this close-up view of the gem, but are they as significant at viewing distance? - only if the exit beam is wider than the pupil, I think, which is generally true if we see only one color in the spectrum of dispersion.----------------


Garry, Bruce

Diamcalc show correctly difference between Intensity and Power for Parallel beam.

Real light source can not produce parallel beams.
The angle size of real light source will be changed too and compensate changes of Intensity ( Brightness of image of source light will be near constant ( astigmatism could change brightness especially for critical angles))
 
Here are the data for the 'same' rays in reverse direction; that is, from bezel-to-table. Note that the dispersion angles are generally less. I have not had time to digest the data yet. Why not have Sergey and his people do the rest?

tolkdispBT.GIF
 
----------------
On 9/16/2004 9:00:30 PM beryl wrote:

Here are the data for the 'same' rays in reverse direction; that is, from bezel-to-table. Note that the dispersion angles are generally less. I have not had time to digest the data yet. Why not have Sergey and his people do the rest?----------------


Bruce, After I start to use cone beam analysis, ray tracing is much less interesting for me.

with the help ray tracing is very difficult to find and to understand most important phenomena’s for Fire and Scintillation. For example ray tracing usually used for describe ( calculation) dispersion.
But if you use cone beam you can easy see what dispersion has not good correlation this Fire.
 
I do not understand 'cone beam analysis' as a method, and related things mentioned by Serg. Where can I read more about it? I think the work I have done here tells us some things.
 
----------------
On 9/17/2004 4:19:03 AM beryl wrote:

I think the work I have done here tells us some things.----------------

Of course. Well done Bruce. I like you style very much.

Sorry I do not know good link about cone beam. I think this technology is not interesting for other market( except diamond analysis). It is not necessary for computer game .
1.gif
 
GET 3 FREE HCA RESULTS JOIN THE FORUM. ASK FOR HELP
Top